[arve url=”https://vimeo.com/203762450″ /]
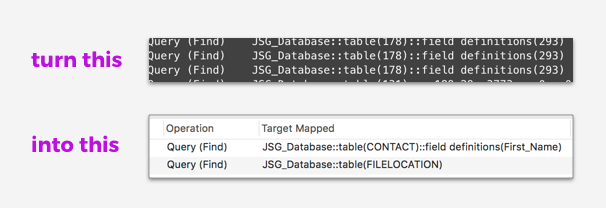
If you turn on the Filemaker Top Call Stats log, FileMaker Server will log the longest running operations, during a log interval. It saves up to 25 calls per logging interval. This is a great resource to help find those areas of your database that might not be performing well. But it is difficult to read. First, there is a lot of data. You’ll need to import it into a FileMaker Database or a spreadsheet to be able to do any kind of sorting or filtering. Second, FileMaker Server doesn’t use the names of elements when it saves them in the log. It uses the internal IDs. This is good for security but it makes it difficult to tell what’s going on. FMPerception has a new feature that can help you make sense of your log.
FileMaker Top Call Stats Remapped!
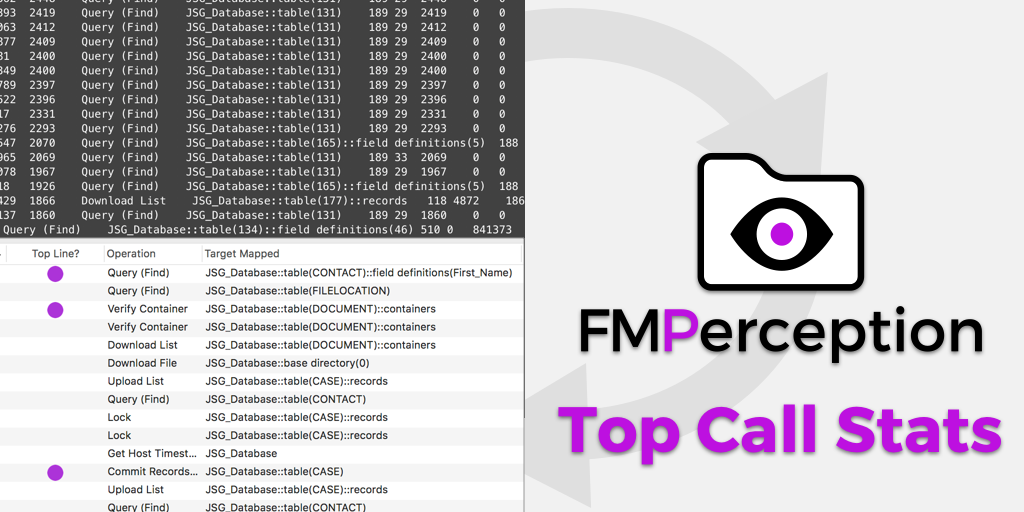
If you put the TopCallStats.log file in a folder with your DDR, right next to the summary.xml file, FMPerception will find it and import it along with the rest of the DDR. Then it remaps the IDs that the log uses with the correct name. Suddenly the log begins to make some sense.
FileMaker Top Call Stats Filtered
FMPerception’s hierarchical approach to navigating and filtering the XML DDR, works really well for slicing and dicing the Top Call Stats Log as well. You can easily find the operations that are taking the most time for all your users or focus in on a particular user, or FileMaker element. If you have used FMPerception the interface will be very familiar.
Documentation
Check out the documentation for more information on how this new feature works.
FMPerception
FMPerception™ is the fastest, most accurate database utility for searching, analyzing and maintaining FileMaker custom apps. It helps you develop the highest-quality FileMaker custom apps – faster and easier than ever before.


Trackbacks/Pingbacks